


Risk-Based Integrity (RBI) helps pipeline operators achieve maximum risk reduction per dollar by focusing on PoF × CoF, prioritizing HCAs, and balancing inspections (ILI, ECDA, DA) with consequence mitigations (API 1175 leak detection, API 1130 CPM). Using KPIs like risk reduction per $ and % segments under ALARP, managers can run defensible, budget-optimized IM programs.
Introduction — Why Risk-Based Integrity Demands Cost Control
For pipeline operators and asset managers, the challenge is constant: how to keep pipelines safe and compliant without overspending. Traditional integrity programs often rely on time-based inspections — inspecting everything on a fixed schedule. But in today’s world of tight budgets and regulatory scrutiny, that approach wastes resources and rarely satisfies stakeholders.
Risk-Based Integrity (RBI) offers a smarter path. By focusing on Probability of Failure (PoF) and Consequence of Failure (CoF), operators can channel budgets to where they deliver the highest risk reduction per dollar.
This principle is reflected in international standards:
- ASME B31.8S for gas transmission pipelines,
- API 1160 for liquid pipelines, and
- CSA Z662 Annex O for Canadian operators.
Each emphasizes that integrity should be managed by risk, not by calendar.
At NWE Group, we help asset owners prove to boards and regulators that their budget-driven integrity strategies are defensible. This playbook provides a cost–benefit roadmap: choosing inspection methods, mitigating consequences, applying KPIs, and making the case for every dollar spent.
📌 Further reading:
• RBI vs TBI — Which Integrity Approach Works Best?
• Pipeline Integrity Assessment vs Management
• Pipeline Integrity Assessment Guide
Foundations of Risk-Based Integrity Management
Risk Equation: Probability of Failure × Consequence of Failure
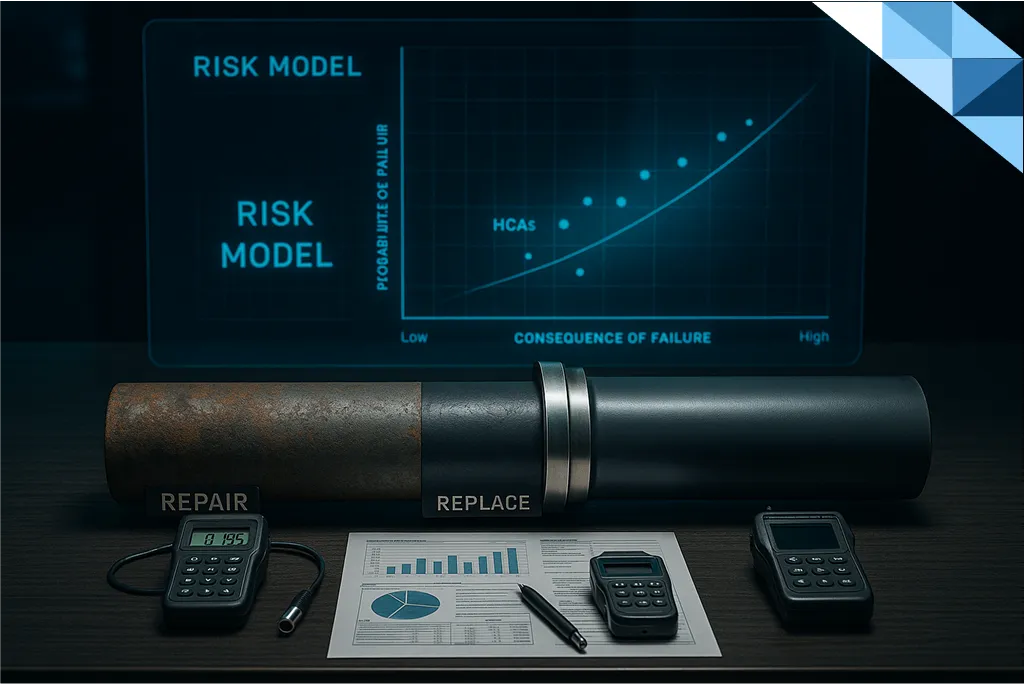
At the heart of Risk-Based Integrity (RBI) lies a simple formula:
Risk = Probability of Failure (PoF) × Consequence of Failure (CoF)
- PoF reflects the likelihood of failure — driven by threats like external corrosion, geohazards, or third-party damage.
- CoF measures the impact if failure occurs — covering safety, environment, production, and reputation.
This framework ensures that operators allocate resources where risk is both likely and costly. For example:
- A remote gathering line may have a high PoF but very low CoF.
- A city-adjacent transmission mainline may have moderate PoF but extreme CoF.
📌 The outcome: instead of spending equally across the network, managers can channel funds to segments where a dollar delivers the most impact.
High Consequence Areas (HCA) and Risk Segmentation
Global standards reinforce this principle:
- ASME B31.8S defines risk assessment methodologies for gas pipelines.
- API 1160 guides liquid pipeline integrity by segmenting threats and impacts.
- CSA Z662 Annex O formalizes risk evaluation for Canadian operators.
Each requires operators to identify High Consequence Areas (HCAs) — zones where a release could cause severe harm (densely populated areas, waterways, environmentally sensitive sites).
Once HCAs are defined, budgets can be prioritized:
- HCAs: highest inspection, monitoring, and mitigation intensity.
- Moderate/Low consequence areas: lighter interventions, longer intervals, reduced spend.
This segmentation not only optimizes resources but also creates a regulator-proof defense. When PHMSA or CSA audits come, documented segmentation shows that decisions were risk-based, not arbitrary.
🔗 See also: Pipeline Integrity Assessment vs Management — a deeper dive into the difference between data collection (assessment) and cost-based decision-making (management)
Risk Models and Regulatory Alignment
PHMSA Risk Assessment Expectations
In the U.S., the PHMSA Integrity Management Rule requires operators to use structured and transparent risk assessments. The goal isn’t perfection — it’s traceability. Regulators want to see how and why decisions were made.
A compliant risk model should include:
- Threat identification (per ASME B31.8S: time-dependent, stable, random).
- Likelihood evaluation using inspection + monitoring data.
- Consequence estimation based on High Consequence Areas (HCAs).
- Documented logic for how inspection intervals and budgets are chosen.
📌 Without a clear risk model, even high spending can look arbitrary. With it, budget-conscious strategies become defensible.
Semi-Quantitative vs. Quantitative Models
A common decision point is whether to adopt a semi-quantitative or quantitative approach:
- Semi-Quantitative Models (scoring systems, e.g., 1–5 for PoF and CoF):
- ✅ Pros: Affordable, fast to implement, and regulator-acceptable.
- ❌ Cons: Simplifies reality, less precise.
- Quantitative Models (numerical failure frequencies, cost-based CoF):
- ✅ Pros: Enables advanced cost–benefit optimization.
- ❌ Cons: Requires extensive data, tools, and expertise.
For budget-limited operators, semi-quantitative models usually provide the best cost–benefit ratio. Many companies now apply a hybrid approach — semi-quantitative for most segments, with quantitative deep-dives in HCAs.
📌 Resource tip: See the Pipeline Integrity Assessment Guide for practical ways to structure risk models without over-investing in tools and consultants.
Resource Optimization: Making Every Dollar Count
When budgets are limited, the real question is not “what could we do?” but “what must we do?”. A strong integrity program ensures that every dollar translates into measurable risk reduction.
Inspection Trade-offs — ILI, ECDA, DA
Inspection is often the largest line item in an integrity budget. Choosing the right method makes the difference between wasted spend and high-value insights.
- In-Line Inspection (ILI):
- ✅ Best for: Piggable transmission pipelines.
- ✅ Strengths: High-resolution data (wall loss, cracks, dents).
- ❌ Limitations: Expensive, requires pigging facilities.
- External Corrosion Direct Assessment (ECDA):
- ✅ Best for: Non-piggable pipelines with coating/CP issues.
- ✅ Strengths: Affordable, phased approach (indirect surveys → digs).
- ❌ Limitations: Data quality varies, and it is less comprehensive than ILI.
- Direct Assessment (DA):
- ✅ Best for: Targeted threats (e.g., SCCDA for Stress Corrosion Cracking).
- ✅ Strengths: Focused, relatively low cost.
- ❌ Limitations: Narrow scope, may miss multi-threat interactions.
📌 Decision rule: Use ILI in HCAs where risk exposure justifies a higher cost. In lower-consequence segments, ECDA or DA provides defensible, budget-friendly alternatives.
Smart Scheduling & Interval Optimization
It’s not only what inspection is done, but when. Poor scheduling can waste resources or increase exposure.
- Over-frequent inspections: Burn budgets without proportional risk reduction.
- Under-frequent inspections: Leave critical risks undetected.
Standards such as ASME B31.8S allow flexible intervals if operators can prove risk remains ALARP (As Low As Reasonably Practicable).
👉 This means longer intervals can be justified in low-risk areas, freeing funds for HCAs.
Prioritizing Interventions
After inspection, operators must decide which anomalies to repair and when. Budget-conscious strategies include:
- Ranking anomalies by risk: severity, growth rate, location, CoF.
- Bundling repairs: minimize mobilization cost by fixing multiple anomalies in one dig.
- Deferring low-risk anomalies: if modeling shows they remain ALARP for several years.
- Investing in prevention: e.g., CP upgrades often provide more value than repairing minor defects.
This triage ensures money isn’t spent on low-value repairs while leaving critical threats unresolved.
Mitigating Consequences: Cost-Effective Safeguards
Even with the best inspections, failures can still occur. The next line of defense is reducing the Consequence of Failure (CoF).
These actions are often cheaper than large-scale inspections yet deliver high impact in minimizing safety, environmental, and financial losses.
Leak Detection Programs (API 1175)
A well-structured Leak Detection Program (LDP), as outlined in API 1175, helps operators:
- Detect leaks early before they escalate.
- Combine multiple detection methods (computational, mass balance, external sensors).
- Continuously improve detection gaps with audits and lessons learned.
For budget-conscious operators, even basic enhancements — like SCADA threshold tuning, alarm rationalization, or staff training — deliver significant CoF reduction per dollar spent.
Computational Pipeline Monitoring (API 1130)
Computational Pipeline Monitoring (CPM), defined in API 1130, leverages real-time SCADA data to flag potential leaks.
- ✅ Pros: Software-based, relatively low CAPEX, faster than manual monitoring.
- ❌ Cons: Requires quality data and calibration.
Many operators start with low-cost CPM solutions and scale later (fiber-optic sensing, drones, external sensors) as budgets grow.
Secondary Barriers & Emergency Preparedness
Not all mitigations require advanced tech. Some low-cost safeguards provide major protection:
- Secondary containment (berms, dikes) near rivers or tanks.
- Pre-positioned response kits in HCAs.
- Emergency drills with local responders.
- Public awareness campaigns so communities can report leaks quickly.
👉 These measures may not prevent failures, but they minimize escalation costs when failures occur. In cost–benefit terms, they often yield the highest ROI in the integrity budget.
Measuring Value: KPIs and Cost–Benefit Metrics
In integrity management, spending is only defensible when value is visible. Executives and regulators want proof that every dollar spent reduced risk, avoided downtime, or protected assets. That’s where Key Performance Indicators (KPIs) come in.
Risk Reduction per Dollar Spent
Perhaps the most persuasive metric:
Risk Reduction ÷ Cost = Efficiency of Integrity Spend
- $500k on ILI + targeted digs = 70% risk reduction in HCAs.
- $500k on low-risk weld repairs = 20% risk reduction.
👉 This KPI shows whether budgets are allocated where they deliver the most safety per dollar.
Downtime Avoided and Production Continuity
Failures are not only safety risks — they’re financial disasters.
A 24-inch crude line outage can cost >$1M/day in deferred production.
By investing in:
- ILI inspections in HCAs, or
- CP system upgrades in corrosion-prone areas,
Operators can demonstrate millions in downtime avoided, reframing integrity as business continuity insurance.
Percentage of Segments Under ALARP
The global benchmark is ALARP (As Low As Reasonably Practicable).
Tracking the % of pipeline segments below ALARP risk provides:
- A clear snapshot of system-wide integrity health.
- A defensible benchmark for regulators.
- A board-level story: “90% of our segments are ALARP — and here’s the cost of getting to 95%.”
📌 Together, these KPIs turn technical data into business language. Instead of asking for a budget, managers can show returns in terms of risk reduction, cost avoidance, and compliance confidence.
Mini-Case Study: Budget Allocation in a High-Risk Pipeline Network
Imagine an operator managing a 450 km transmission pipeline with:
- 30% of the length in HCAs (near cities, rivers, or sensitive environments).
- Annual budget: $2M for integrity.
- Threat profile: external corrosion + third-party interference.
The key challenge: how to maximize risk reduction with limited funds.
Step 1: Cover the Highest-Consequence Segments
💰 $1.0M → ILI on 120 km of HCA pipeline
- Detects corrosion, cracks, and dents with high precision.
- Provides regulator-credible data.
- Justifies spending by protecting people, the environment, and reputation.
Step 2: Assess Non-Piggable Lines
💰 $400k → ECDA on 80 km of non-piggable pipelines
- Targets coating damage + CP issues.
- Less comprehensive than ILI but defensible, cost-effective.
Step 3: Strengthen Mitigation & Monitoring
💰 $300k → Leak Detection Program upgrades (API 1175)
- Better SCADA thresholds.
- Operator training for faster response.
💰 $150k → Emergency response kits near rivers
- Reduces escalation cost if leaks occur.
Step 4: Preventive Investments
💰 $150k → Targeted CP upgrades
- Slows corrosion in medium-risk zones.
- Protects against future high-cost digs.
✅ Result:
- 90% of HCA segments were inspected with ILI.
- 80 km of non-piggable lines assessed via ECDA.
- Mitigation + preparedness investments reduce consequence costs.
- All spending is traceable, defensible, and optimized.
This case demonstrates that with risk-based prioritization, even a limited budget can achieve compliance, safety, and financial efficiency.
Conclusion — The Executive Playbook
Risk-Based Integrity on a budget isn’t about spending less — it’s about spending smarter. Asset owners and managers who succeed use a disciplined framework that links risk assessment, cost–benefit analysis, and consequence mitigation into one coherent strategy.
Here are 8 practical recommendations for decision-makers:
- Adopt risk-based frameworks (ASME B31.8S, API 1160, CSA Z662): Use global standards to structure decisions.
- Document every decision: Regulators value traceability over perfection. A documented rationale makes budgets defensible.
- Prioritize HCAs: Allocate the first dollars to segments where a single failure has the highest consequence.
- Balance inspection methods: Use ILI in HCAs, but apply ECDA or DA in low/moderate consequence areas to stretch budgets.
- Invest in consequence reduction: Leak detection (API 1175), CPM (API 1130), and emergency readiness often deliver the biggest ROI.
- Track KPIs that speak to finance: Risk reduction per $, downtime avoided, and % of segments below ALARP.
- Bundle and phase interventions: Combine digs, align work with outages, and phase upgrades to cut costs.
- Communicate in business language: Translate technical outcomes into financial and reputational benefits to secure board support.
By following this playbook, operators can deliver a program that is compliant, defensible, and financially optimized — proving that even under budget constraints, pipeline integrity and safety remain uncompromised.
Frequently Asked Questions (FAQ)
- What’s the difference between Risk-Based Inspection (RBI) and Time-Based Inspection (TBI)?
RBI allocates resources where PoF × CoF is highest, while TBI applies fixed schedules regardless of risk. RBI is more cost-effective and regulator-preferred. - How do regulators expect operators to justify risk-based cost decisions?
Authorities like PHMSA, CSA, and ASME require operators to demonstrate documented models, segmentation logic, and inspection intervals — not unlimited budgets. - What’s the most cost-effective inspection method for small operators?
For non-piggable lines, ECDA is usually the most affordable and defensible choice, while ILI is reserved for HCAs. - How do I choose between repairing or replacing a corroded segment under budget constraints?
Base the decision on defect growth rate + CoF. If risk stays ALARP with repair, replacement can be deferred. If not, replacement is mandatory. - How can KPIs prove to management that integrity spending delivers value?
By using metrics like risk reduction per $, downtime avoided, and % of segments below ALARP, managers translate technical work into financial outcomes. - What low-cost measures deliver the highest impact in reducing pipeline risk?
Leak detection upgrades, CP tuning, emergency drills, and public awareness programs often yield outsized risk reduction at relatively low cost. - How often should risk models be updated if budgets are tight?
At least annually, and immediately if significant new inspection data or incidents occur. HCAs may need more frequent updates than stable, low-risk areas.
👉 Ready to turn your integrity program into a cost–benefit success story?
Explore our Asset Integrity Management and see how NWE Group helps operators build defensible, optimized RBI programs tailored to their budgets.

2 Responses
Useful KPIs. I’ll definitely apply the ALARP segment tracking idea
The article effectively explains how Risk-Based Integrity (RBI) enables pipeline operators to maximize safety and compliance while optimizing budgets through targeted inspections and consequence mitigation.